The typical Brentwood home was worth $1,388,985 in September 2026, up 4.1% in a year, Zillow says. Homes took a median 55 days to go under contract.
Last checked Oct. 17, 2026. Figures come from Zillow Research’s public data files (September 2026, the latest month published) and the Federal Housing Finance Agency’s House Price Index (second quarter of 2026). This page is refreshed monthly.
The typical Brentwood home was worth $1,388,985 in September 2026, according to the Zillow Home Value Index. That is 4.1% above September 2025, when the figure was $1,334,485, and the highest level in the three years shown below. Homes are taking longer to sell, though: the median Brentwood listing needed 55 days to go under contract in September, up from 19 days a year earlier.
What this means for you
- Buyers: values are still rising, but slower sales since midsummer give more time to look and negotiate.
- Sellers: plan for nearly two months to an accepted offer, not the two to three weeks of last spring.
- Owners: your tax value comes from the Williamson County Property Assessor, not Zillow. Questions or appeals: 615-790-5708. See our property tax guide.
Three years of Brentwood home values
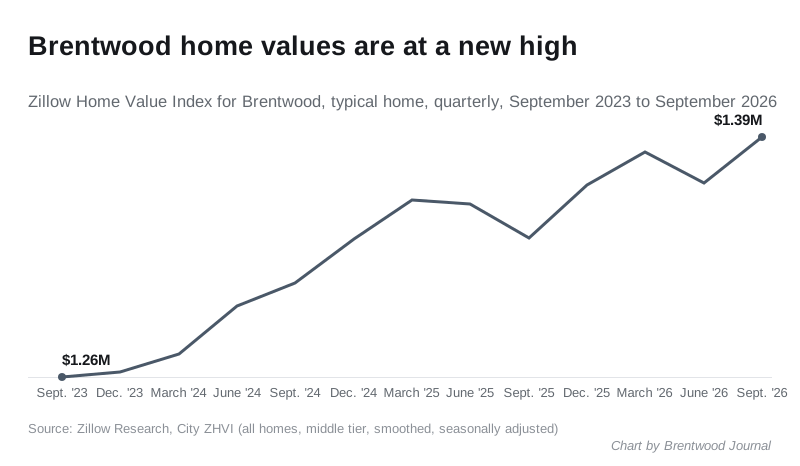
The index climbed steadily through 2024 to $1,358,321 in May 2025, slipped to $1,334,485 by September 2025, then rose again to a new high this fall after a smaller dip in the spring of 2026.
The numbers
| Measure | Latest | A year earlier | Change |
|---|---|---|---|
| Typical home value, Brentwood (Zillow index) | $1,388,985 (Sept. 2026) | $1,334,485 | +4.1% |
| Typical home value, Williamson County (Zillow index) | $916,175 (Sept. 2026) | $890,672 | +2.9% |
| Median sale price, Brentwood (Zillow) | $1,350,000 (Aug. 2026) | $1,525,000 | -11.5% |
| Median days to pending, Brentwood (Zillow) | 55 days (Sept. 2026) | 19 days | +36 days |
| FHFA price index, Nashville-Davidson-Murfreesboro-Franklin metro | 485.29 (2nd quarter 2026) | 477.48 | +1.6% |
Sources: Zillow’s city home value file, county home value file, city median sale price file and city days to pending file; FHFA’s quarterly metro index.
How to read these figures
The Zillow Home Value Index estimates the value of a typical home in the middle third of the market, single-family homes and condos together, smoothed and adjusted for the season. It covers all homes, not just those that sold, so it moves slowly. It is the best single number for “what is a typical Brentwood home worth.”
Median sale price is the middle price of homes that actually sold that month, and in a city Brentwood’s size it swings widely. Zillow’s figure was $1,543,750 in June 2026, $1,430,000 in July and $1,350,000 in August. The 11.5% drop from August 2025 says more about which homes sold than about values; read the trend over several months.
Days to pending counts the days from listing to an accepted offer. Brentwood’s figure fell to 9 days in March and stayed between 10 and 16 days through June, then rose to 34 in July, 46 in August and 55 in September.
The FHFA House Price Index tracks repeat sales of the same homes with mortgages backed by Fannie Mae and Freddie Mac. FHFA does not publish an index for Brentwood alone; the closest is the Nashville-Davidson-Murfreesboro-Franklin metro area, which rose 1.6% in the year to the second quarter of 2026. The index measures change, not price.
Brentwood against its neighbors
| City | Typical home value, Sept. 2026 | A year earlier | Change |
|---|---|---|---|
| Brentwood | $1,388,985 | $1,334,485 | +4.1% |
| Franklin | $913,277 | $886,493 | +3.0% |
| Nolensville | $834,285 | $805,615 | +3.6% |
| Nashville | $425,889 | $436,922 | -2.5% |
| Smyrna | $400,537 | $403,666 | -0.8% |
| La Vergne | $345,627 | $351,642 | -1.7% |
Brentwood is the most expensive of the six by this measure, and its values rose fastest. Nolensville, about six miles east, and Franklin, about seven miles south, also gained; Nashville, about 12 miles north, and the Rutherford County cities of Smyrna and La Vergne slipped.
The Census Bureau’s 2020-2024 American Community Survey five-year estimates put the median value of owner-occupied homes in Brentwood at $1,031,300. That survey asks owners what they think their home is worth and covers 2020 to 2024, so it runs below current market figures.
Where to look up a specific home
- Sales recorded in Brentwood: our weekly real estate transfers column lists deeds recorded in Williamson County.
- Appraised value and property card: the county’s property data search.
- State assessment records: the Tennessee Comptroller’s real estate assessment data.
Related guides: property taxes, moving to Brentwood and Brentwood population and growth.
Area by area: our Brentwood neighborhoods guide covers 10 parts of the city with their zoned schools, parks and commutes.
Frequently asked questions
What is the average home price in Brentwood, Tennessee?
The typical Brentwood home was worth $1,388,985 in September 2026, according to the Zillow Home Value Index. Zillow’s median sale price for August 2026 was $1,350,000.
Are home prices going up in Brentwood, TN?
Yes. Zillow’s index rose 4.1% from September 2025 to September 2026 and reached a new high, about 10% above September 2023.
How fast are homes selling in Brentwood?
Brentwood homes took a median 55 days to go under contract in September 2026, compared with 19 days in September 2025, by Zillow’s count.
Is Brentwood more expensive than Franklin?
Yes. Brentwood’s typical home value of $1,388,985 in September 2026 was about 1.5 times Franklin’s $913,277 and about 1.5 times the Williamson County figure of $916,175.
Have your say